Introduction to Roller Coaster Design
(Example)
Coaster Design Home Page
Intro to Design Example
This will show the reader the basic steps to designing a roller coaster. The example coaster will not be the best possible design. (I don’t want students to use it as their own in other projects.)
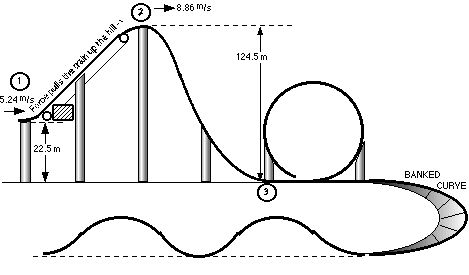
STEP 1 Draw a picture of what the coaster may look like.

STEP 2 Assign some beginning numbers.
Numbers like the initial velocity as the coaster train leaves the station. The mass of the coaster train. And/or an initial velocity as it tops the first hill. (Label the pieces for easy identification when analyzing.)

STEP 3 Begin to calculate everything you can and check to see if it makes sense.
For this design start by calculating the force needed to pull the train up the incline and the power to pull it up the incline.
In order to calculate the power force and power to pull it up the incline I’m going to need the train’s mass. So make up a reasonable mass. This coaster is made up of 6 cars. Each car has a maximum mass, with two riders at 100 kg each, of 735 kg; (535 kg car + 100 kg rider + 100 kg rider.) Therefore, the coaster train will have a mass of 4410 kg.
What angle will the first incline be? The designer can choose this number too. 42° is good. The train is going to be pulled up vertically a distance of, (124.5-22.5), 102.0 m.

Incline length = 102/(sin42°)
Incline length = 152.4 m
ET(OUT OF STATION) + Work = ET(TOP OF 1st HILL)
KE + PE +W = KE +PE
(1/2)mv2 + mgh + Fd = (1/2)mv2 + mgh
(1/2)4410(5.24)2 + 4410(9.8)(22.5) + F(152.4) = (1/2)4410(8.26)2 + 4410(9.8)(124.5)
60544.008 + 972405 + F(152.4) = 150441.858 + 5380641
F(152.4) = 4498133.85
F = 29515.314 N ... is the pulling force along the incline.
How much time will it take to travel up the incline?
The acceleration of the train is found from
(vf)2 = (vo)2 +2ad
(8.26)2 = (5.24)2 + 2(a)d
a = 0.134 m/s2
vf = vo + at
8.26 = 5.24 + 0.134(t)
t = 22.537 sec ...is the time to climb the incline.
(Most initial lift times are between 60 and 120 seconds.)
It is beyond the scope of these pages to show how to calculate the time for each track element. It was shown here because of its ease of calculation.
STEP 4 Calculate maximum velocity of the ride.
Since the 1st drop is the longest, the velocity at the bottom will be the greatest, (location #3). Energy relationships will be used to calculate the velocity.
ET(LOCATION #2) = ET(LOCATION #3)
KE + PE = KE +PE
(1/2)mv2 + mgh = (1/2)mv2 + mgh
(1/2)4410(8.26)2 + 4410(9.8)(124.5) = (1/2)4410(v)2 + 4410(9.8)(0)
150441.858 + 5380641 = 2205(v)2
2508.428 = (v)2
v = 50.084
v = 50.1 m/s ... At the bottom of the first hill
That’s 112 mi/hr !!!
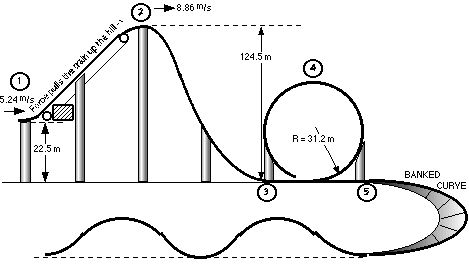
STEP 5 The loop.
For any loop, the designer would like to know the velocity as the rider enters the loop; at the top of the loop; and as the rider leaves the loop. The designer would also like to know the g’s felt by the passengers. This is the location on the ride where riders are most likely to pass out if the g’s are too much. The radius in the loop below is made up.
The velocity as the rider enters the loop and as the rider leaves the loop is the same as the velocity at the bottom of the first hill. This is because all three locations are at the same height.
The velocity at the top of the loop is not the same as at the bottom. As the coaster travels up the loop it will lose kinetic energy and gain potential energy.
The height of the loop is simply double the radius. h = 2(31.2) = 62.4 m
ET(LOCATION #2) = ET(LOCATION #4)
KE + PE = KE +PE
(1/2)mv2 + mgh = (1/2)mv2 + mgh
(1/2)4410(8.26)2 + 4410(9.8)(124.5) = (1/2)4410(v)2 + 4410(9.8)(62.4)
150441.858 + 5380641 = 2205(v)2 + 2696803.2
1285.388 = (v)2
v = 35.852
v = 35.9 m/s ... At the bottom of the first hill
That’s 80.3 mi/hr !!!
If you are doing this calculation and you get an expression that requires you to calculate the velocity by taking the SQUARE ROOT OF A NEGATIVE NUMBER, then the loop is too tall for the given velocity at the bottom of the loop. The velocity will need to be increased or the height of the loop decreased.
To calculate the g’s felt by the rider, calculate the centripetal acceleration at each location, convert to g’s and either add or subtract a g as necessary.
As the rider enters and leaves the loop
v = 50.084 m/s
r = 31.2 m

ac = 8.2 g’s
ac = 8.2 g’s + 1g
ac = 9.2 g’s ... That is an incredible amount of g’s. Most coasters do not go above 5 g’s. To be safe the radius at the bottom of the loop needs to be bigger.
As the rider passes the top of the loop
v = 35.852 m/s
r = 31.2 m

ac = 4.2 g’s
ac = 4.2 g’s - 1g
ac = 3.2 g’s ... That is an acceptable amount. But 3.2 g’s is rather high for the top of a loop. Most of the time the g’s at the top of a loop are from 1.5 to 2 g’s.
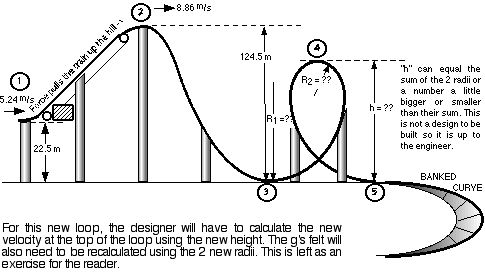
Because of the need for a larger radius as the rider enters the loop above, this coaster might be a good candidate for an irregular loop like the one below.
STEP 6 The banked curve.
The banked curve is a horizontal curve on the ground in this diagram. Because it is at the lowest point it’s velocity is equal to that of location #3, where v = 50.084 m/s. For a first try I’ll make the radius 31.2 m.

The curve will be designed at the optimum angle where no friction or outside lateral forces are needed to keep the car on the track at speed. “At speed” means the velocity of the track design.

q = 9.3° .... That’s almost a flat turn. It might be more exciting to try to decrease the radius so a greater banking angle will be needed.
The g’s felt are calculated from

g’s felt = 1.013 g’s .... This is not much more than normal gravity. These g’s are the g’s felt applied to your seat. Because this curve is rather flat, it would be wise to examine lateral, centripetal, acceleration in g’s.
Lateral g’s are the g’s felt in the horizontal plain of the curve.
v = 50.084 m/s
r = 31.2 m ... of the curve. This just happens to be the same as the loop’s radius.

ac = 8.2 g’s ... Do not add or subtract a “g” because the circular motion is horizontal and not in the vertical plain.
... That is a lot of lateral g’s. That’s 8.2 times the rider’s weight pressing him against the side of the coaster car. It is too extreme. Maybe a value around 1 to 2 g’s would be better tolerated by the rider.
The banked curve needs to be redesigned.
STEP 7 The camel back
The camel back humps begin at the lowest part of the track and climb to a height of 21.5 m. The calculations to check the velocity at the top of the hump is similar to the one for the drop from location 2 to 3.

ET(LOCATION #7) = ET(LOCATION #8)
KE + PE = KE +PE
(1/2)mv2 + 0 = (1/2)mv2 + mgh
(1/2)v2 + 0 = (1/2)v2 + gh
(1/2)(50.084)2 + 0 = (1/2)(v)2 + (9.8)(21.5)
1254.203528 = (1/2)(v)2 + 210.7
2087.007056 = (v)2
v = 45.6838
v = 45.7 m/s ... At the bottom of the first camel back hill.
That’s 102 mi/hr !!!
It might be wise to decrease the height of the first drop to decrease the velocity of the coaster as it enters the loop and the banked curve. Then, redesign the loop and banked curve to reduce g’s experienced by the rider. As for the camel back humps at the end of the ride, they probably need to either be taller or stretched out horizontally. They are too narrow, horizontally, for 45.7 m/s.
1 The normal force is the force perpendicular to a surface. The floor is exerting a normal force straight up equal to your weight right now.
|